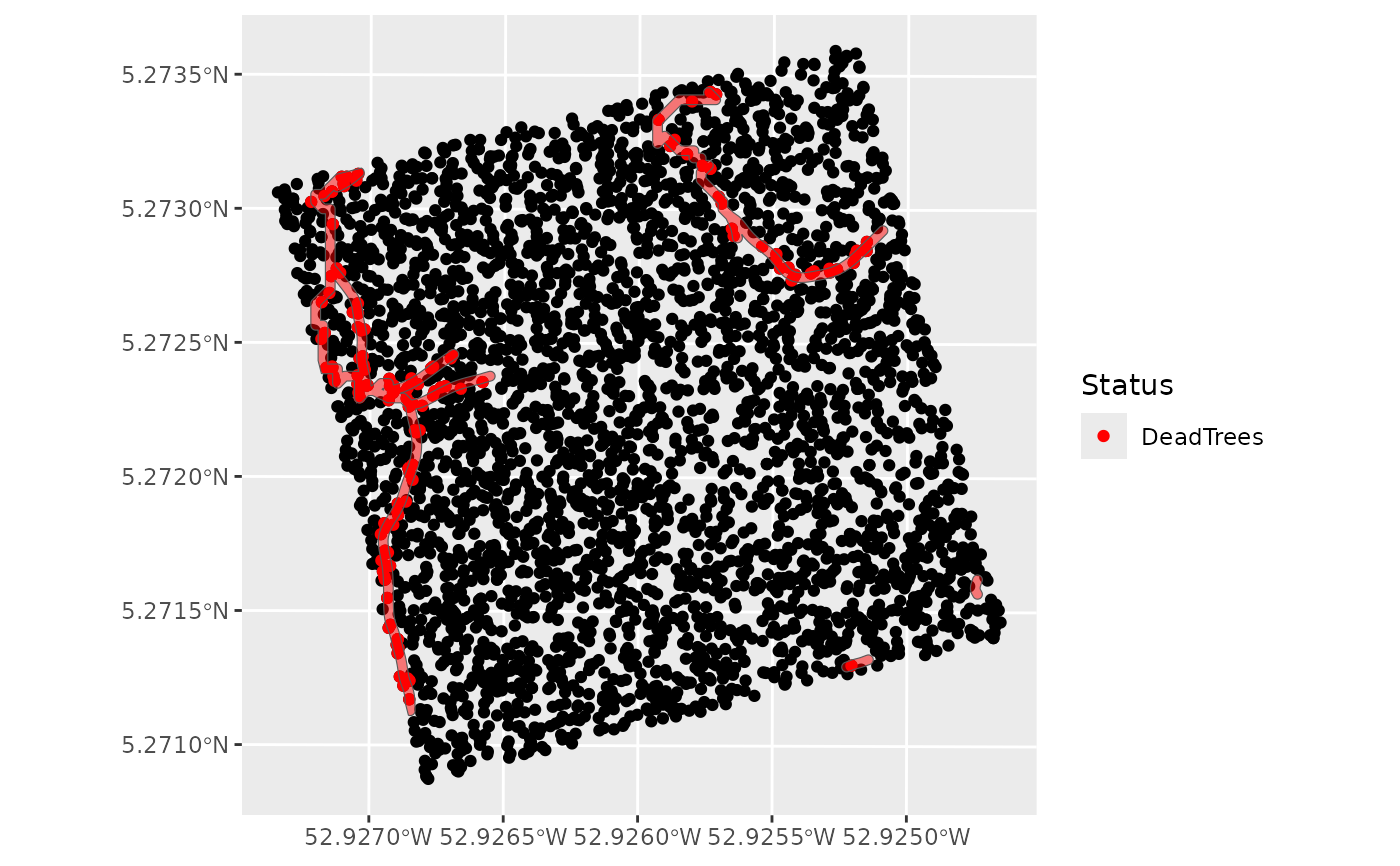
Trees removed under polygons
Arguments
- inventory
Input inventory (see the inputs formats and metadata in the vignette) (data.frame) with at least the following columns:
"idTree": unique ID of the tree
"Xutm": X coordinate of the tree
"Yutm": Y coordinate of the tree
"Selected": == "1" for the trees selected for logging.
- polygons
Polygon(s) (trails, landings) under which trees are removed. (POLYGON or MULTIPOLYGON with a crs in UTM)
- deathcause
The cause of the tree death under the polygon(s) among: "maintrail", "2ndtrail", "treefall2nd", "landing" (character)
Examples
# inventory
data(Paracou6_2016)
data(DTMParacou)
data(SpeciesCriteria)
data(MainTrails)
data(HarvestableAreaOutputsCable)

Paracou6_2016 <- tibble::add_column(Paracou6_2016, DBH= NA) # add a DBH column
Paracou6_2016$DBH = Paracou6_2016$CircCorr/pi # and calculate it
Paracou6_2016 <- dplyr::filter(Paracou6_2016, DBH >= 10)

inventory <- addtreedim(Paracou6_2016,
                        volumeparameters = ForestZoneVolumeParametersTable)

inventory <- suppressMessages(treeselection(inventory,
  topography = DTMParacou,
  speciescriteria = SpeciesCriteria,
  scenario = "RIL2",
  specieslax = FALSE, objectivelax = TRUE,
  harvestablearea = HarvestableAreaOutputsCable$HarvestableArea,
  plotslope = HarvestableAreaOutputsCable$PlotSlope,
  maintrails = MainTrails,
  harvestablepolygons = HarvestableAreaOutputsCable$HarvestablePolygons
  )$inventory)

# polygon
data(SecondaryTrails)
polygons <- SecondaryTrails$SmoothedTrails
deathcause <- "2ndtrail"

Rslt <- mortalityunderpolygon(inventory,
                              polygons,
                              deathcause)
library(ggplot2)
library(sf)
inventory <- st_set_crs(st_as_sf(Rslt, coords = c("Xutm", "Yutm")),
                                 st_crs(polygons))

DeadTrees <- sf::st_as_sf(
dplyr::filter(inventory, DeathCause == deathcause),
              coords = c("Xutm", "Yutm"))
ggplot() +
  geom_sf(data = inventory) +
  geom_sf(data = DeadTrees,
  aes(colour = "DeadTrees"), show.legend = "point") +
  geom_sf(data = polygons,
  alpha = 0.5, fill = "red") +
  scale_colour_manual(values = c("DeadTrees" = "red")) +
  labs(color = "Status")
